Interactive-Website-Performance-Report
Interactive Monthly Website’s Performance Report Template
Overview
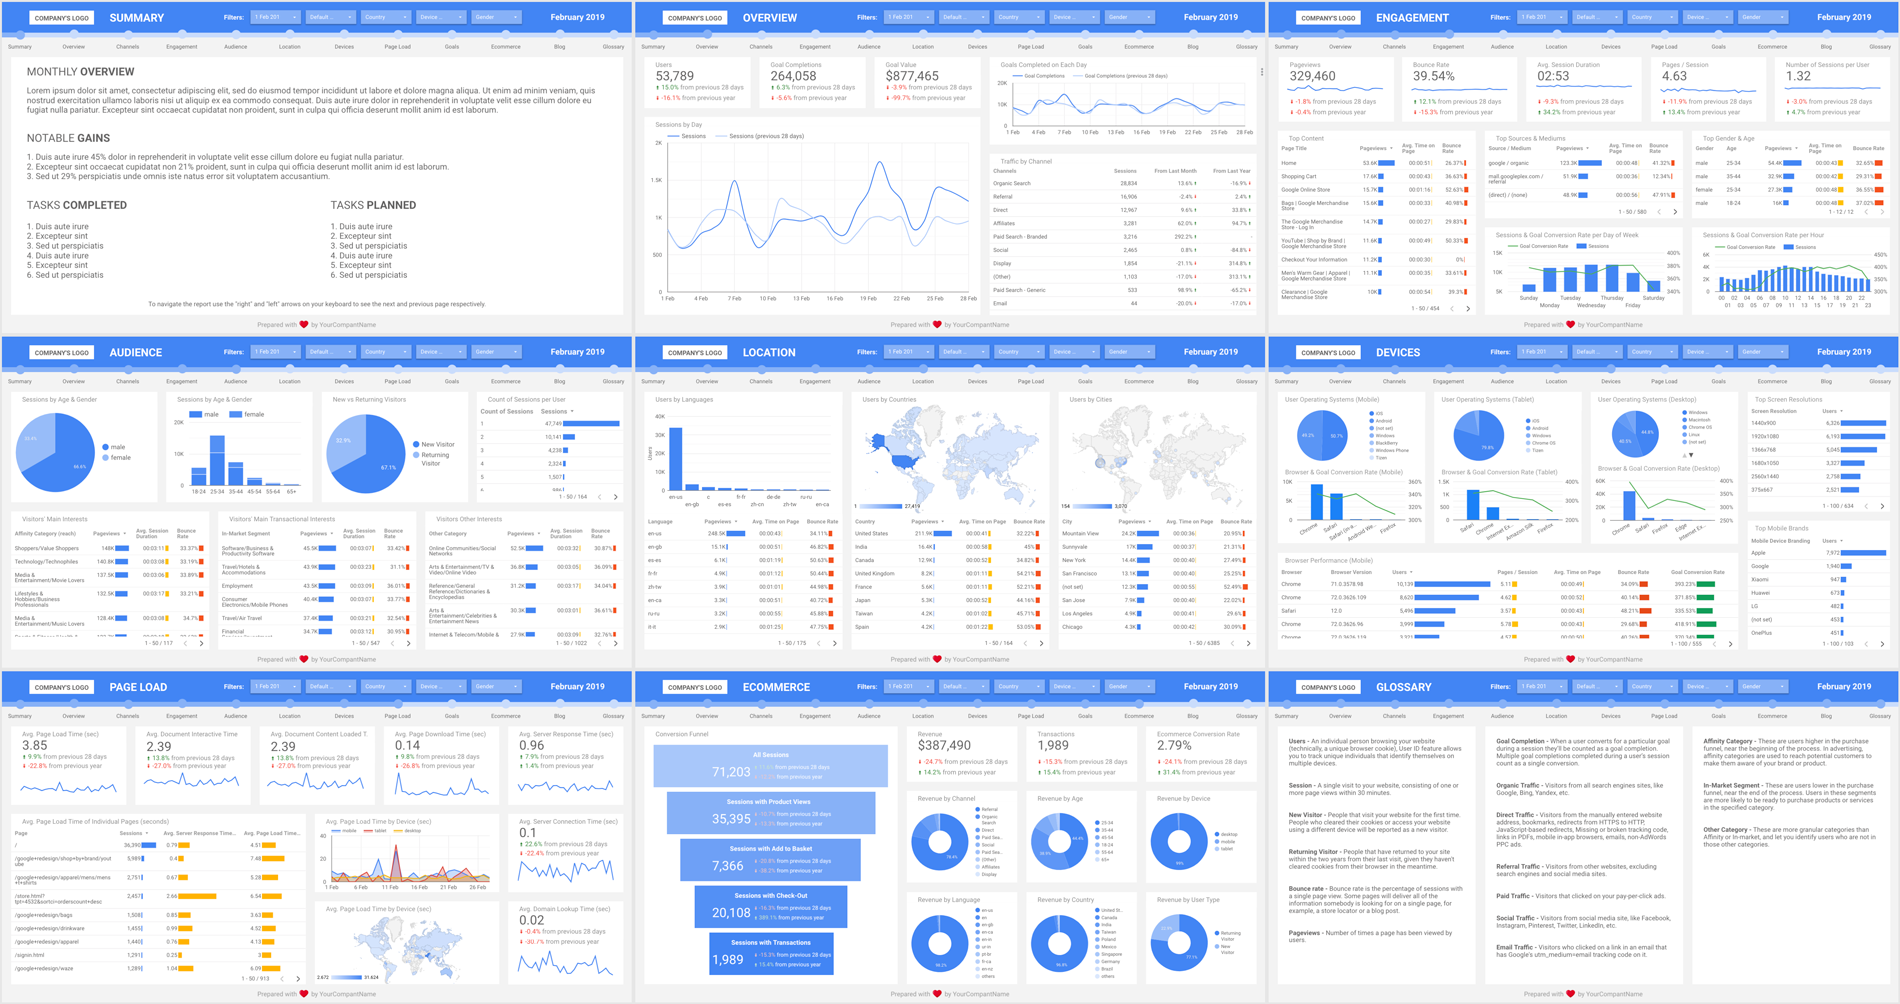
It is an open-source report template that helps a digital team analyse the website’s performance over a given month in comparison to the previous period and the same period last year, and highlight important findings to the top management.
It takes data from your site using Google Analytics and displays it in Google Data Studio (a free online tool for visualising a large amount of data), to find useful insights.
Google Data Studio can load data from all kinds of sources, for example, Google Analytics, Google Search Console, Google Ads, Google Sheets, BigQuery, Facebook Ads and a lot more.
Versions Ready to Use
Version 1.3
Google Analytics (Summary, Fundamental pages, Blog, Goals, Ecommerce) & Google Ads - designed for any website that uses Google Analytics, has a blog, Goals and Enhanced Ecommerce set up in Google Analytics and uses Google Ads to promote this website online.
Changelog:
- Added pages: Google Ads Summary and Google Ads Audience
- Expanded page: Glossary
- Enabled report-level filter: Age
- Enabled chart and table filters
- Enabled chart drill-down
- Making items in the top navigation clickable
- Corrected positive and negative colours for all page load and bounce rate scorecards
- Multiple small improvements
Version 1.2
- Google Analytics (Summary, Fundamental pages) - designed for any website that uses Google Analytics.
- Google Analytics (Summary, Fundamental pages, Blog) - designed for any website that uses Google Analytics and has a blog.
- Google Analytics (Summary, Fundamental pages, Goals) - designed for any website that uses Google Analytics and has Goals set up in Google Analytics.
- Google Analytics (Summary, Fundamental pages, Ecommerce) - designed for any website that uses Google Analytics and has Enhanced Ecommerce set up in Google Analytics.
- Google Analytics (Summary, Fundamental pages, Goals, Blog) - designed for any website that uses Google Analytics and has a blog and Goals set up in Google Analytics.
- Google Analytics (Summary, Fundamental pages, Ecommerce, Blog) - designed for any website that uses Google Analytics and has a blog and Enhanced Ecommerce set up in Google Analytics.
- Google Analytics (Summary, Fundamental pages, Goals, Ecommerce, Blog) - designed for any website that uses Google Analytics and has a blog, Goals and Enhanced Ecommerce set up in Google Analytics.
Changelog:
- Enabled report-level filters: Date Range, Marketing Channel, Country, Device and Gender
- Expanded pages: Engagement and Glossary
- Removed page descriptions from all pages
- Added ‘Prepared with
[heart-icon]by YourCompanyName’ in the footer of every page as a small branding accent - Decreased page side margins
- Created report variations for specific use cases to avoid showing charts with no data
- Multiple small improvements
Version 1.1
Google Analytics (Summary, Fundamental pages, Goals, Ecommerce, Blog) - designed for any website that uses Google Analytics and has a blog, Goals and Enhanced Ecommerce set up in Google Analytics.
Changelog:
- Added pages: Audience, Page Speed, Blog and Glossary
- Expanded page: Device
- Temporarily removed links from the top navigation bar to avoid confusion when you copy the report, and navigation items are still linked to the original report
- Multiple small improvements
Version 1.0
Google Analytics (Summary, Fundamental pages, Goals, Ecommerce) - designed for any website that uses Google Analytics and has Goals and Enhanced Ecommerce set up in Google Analytics.
Changelog:
- Added pages: Summary, Overview, Channels, Engagement, Devices, Location, Goals and Ecommerce
- Designed theme
- Added navigation bar with links to jump between pages
Instructions
Here are detailed step-by-step instructions for using this report to analyse a website you manage.
- Google Data Studio account
- Log into your Google Data Studio account or create a free account.
- Select a report
- Click on a link to one of the reports above that you would like to use.
- Copy the report
- Move your mouse cursor to the top edge of the report window. The top navigation bar will appear.
- On the right-hand side, you will see an icon with two rectangles, one on top of another. Click on it to make a copy of the report.
- In the pop-up window, select a new Data Source. You can use ‘Sample Google Analytics Data’ if you would like to just play with the report or click on a drop-down field below the heading ‘New Data Source’. Then, click the ‘Create New Data Source’ button at the bottom if you would like to use data from one of the sites that you manage. In the search box, type ‘Google Analytics’ and select it. Then, press the ‘Authorize’ button, and ‘Allow’ on the page that appears. Now select a Google Analytics account, then a property, and finally a view of the website for which you would like to use this report. Next, click the ‘Connect’ button in the top-right corner. Then, select the ‘Add to Report’ button in the top-right corner. Press the ‘Copy report’ button. You can find more information about this step in the Google Analytics data source tutorial at the Google Help Center.
- Give it an appropriate name like ‘Website Performance Report for Company X - March 2019’ by clicking on the text ‘Website Performance Report…’ in the top-right corner.
- Edit the report
- If you are not in ‘Edit mode’, move your mouse cursor to the top edge of the report window. The top navigation bar will appear. Then, click the grey button that says ‘Edit’. Now you can change anything in this report.
- Go to ‘File’ (top navigation bar), select ‘Report Settings’, and select the date range for which you would like to show the data (to do this, you need to first select the report-level data source). Once done, it will be updated on all pages.
- Remove the ‘Company’s Logo’ placeholder. Once removed, it should automatically disappear from all pages. Then, add your company’s or client’s logo by going to ‘Insert’ (top navigation bar), and then selecting ‘Image’. Upload the logo, resize it and place it in the top-left corner. Right-click on it and select ‘Make report-level’. The logo will appear on all pages in this report.
- Replace ‘YourCompanyName’ in the footer with your company name.
- Update the text field in the top-right corner so that it reflects the month and year from which the data was pulled.
- Update information on the ‘Summary’ page.
- If the report includes the ‘Blog’ page, you need to make the following changes: 1) In the section ‘Session by Authors,’ you need to edit the table and change the dimension ‘Brands’ to ‘Authors’, 2) In the section ‘Session by Content Categories,’ you need to edit the table and change the dimension ‘Product Categories’ to ‘Post Categories’ and 3) Select ‘Resources’ in the top navigation bar, and then choose ‘Manage Filters’. You will need to edit ‘Blog Pages’ and ‘Blog as a Starting Point’ filters by clicking the ‘EDIT’ buttons. Replace ‘/google+’ with the name of the directory that the blog posts contain in the URL. For example, if you post a URL that looks like www.example.com/blog/post-name/, enter in the field ‘/blog/’; if it looks like www.example.com/insights/post-name/, enter in the field ‘/insights/’.
- Optional improvements
- Make page names in the top navigation bar clickable by adding links to them.
- Make titles of pages on a website clickable by creating a calculated field like HYPERLINK(CONCAT(“//mydomain.com”, Page), Page Title).
- Add any branding that you want (for example, your company logo, contact details, change the theme colours, etc.).
- Add a Google Analytics tracking code to the report by creating a new Google Analytics account or just a property. Then copy the tracking ID into your Google Data Studio report, under ‘File’ (top navigation bar) > ‘Report Settings’ > ‘Google Analytics Tracking ID’ section. It allows you to analyse how your client uses the report to make it even better.
- To enable this report to be embedded onto a page go to ‘File’ in the top navigation and select ‘Embed report’, then check the ‘Enable embedding’ checkbox and press the ‘Finished’ button.
- Check each page
- Glance through each page to make sure you are happy with everything. For some sites, a few charts might not show data. Report an issue on GitHub, and I will try to help you out.
- Share the report
- To share a link to the report with your client or your team, click on an icon of a person with the plus sign beside it in the top right-hand corner. Enter an email of a person that you would like to send an invitation to see this report. In the drop-down field on the right-hand side, select whether you would like to give that person an editor only viewer permission.
- To save the report as a PDF and send a static version of it to the customer, go to ‘File’ (top navigation bar), select ‘Download as’ and select ‘PDF’.
- Navigate the report
- To go to the next page use links in the top navigation or the “right” and “left” arrow on your keyboard.
- Using the report
- In the ‘View’ mode, you can drill down into data shown in some charts, by right-clicking on it and selecting a ‘Drill down’ option. You can also drill down into a value specific value in charts, for example, traffic by hour on specific data of the week. To do it, select a value in a chart you would like to investigate in the chart, then by right-clicking on it and selecting a ‘Drill down’ option.
- From version 1.3, you can click on data in all charts and most tables to show only data on this page that relate to the specific data
An Open-Source License
License: MIT license
If you are interested in making this Google Data Studio report template event better, feel free to contact me. It will be great to join forces with you on this amazing journey to help everyone easily prepare an interactive report template that shows the performance of any website.
Work in Progress
Version 1.4
Google Analytics (Basic pages, Blog, Goals, Ecommerce) & Google Ads & Google Search Console - designed for any website that uses Google Analytics, has a blog, Goals and Enhanced Ecommerce set up in Google Analytics, uses Google Ads to promote this website online and has Google Search Console account set up.
Changelog:
- Adding page: Search Console
Contributing
Thank you for thinking about contributing to the Interactive Website Performance Report Template project! If you’re unsure of anything, know that you’re welcome to submit an issue or pull request on any topic. We appreciate any sort of contribution and don’t want a wall of rules to get in the way of that.
Google Data Studio Courses
- Free:
- An official Google Data Studio Introduction Course by Google
Helpful Resources
- Data Studio Help Community
- What’s new in Google Data Studio
- Google Data Studio features requests tracker
- A list of available functions for calculated fields
Credits
This report template couldn’t be prepared without amazing people who experimented with Google Data Studio previously and shared their work and knowledge with the community. I would like to thank all of them for doing so and inspiring the creation of this report by listing them below.
Google Analytics Reports
Multiple pages
- DigitalSasi Web Analytics 3.1 by DataSasi
- E-commerce Website Analytics Data Studio Report by Onur SOYLAN
- Funnel Visualizer by by Click Targeter
Overview
- GA Audience Overview with Data Control by Unknown
- Monthly Overview by Bounteous
- Acquisition EEG by Joshua Cottrell-Schloemer
SEO
- SEO report by Webris
Website Goals and page descriptions
Page Speed
AMP
- AMP Insights by Google
Engagement
Acquisition
- GA Acquisition Overview with Data Control by Unknown
Behaviour
Ecommerce
- Google Merchandise Store Ecommerce Report by Unknown
- Google Merchandise Store by Digital Allies
- E-commerce Website Analytics Data Studio Report by Onur SOYLAN
Technology
Content
- Blog Content Performance by Unknown
Conversion Funnel
Audience
- La Crosse Audience Report by River Valley Media Group
- Audience Explorer Analytics Dashboard by Ned Berke
A/B Tests
Google Search Console Reports
- Reporting Search Performance in Google Data Studio by Online Behavior
- Using Google Data Studio for a more actionable Google Search Console Performance Dashboard by Aleyda Solis
- Google Search Console and Data Studio for SEO Questions Analysis by Helpfullee
- Google Search Console Data into Google BigQuery by Ben Powis
- How to Take Search Console to the Next Level with Google Data Studio by Sam Marsden
Google Ads Reports
- Google Ads Overview Report by Google
- Adwords Sample Report by Resultrix
- Adwords Data Studio Template Report (Free Google Ads) by One PPC
- Google AdWords Dashboard by Christian Penseler
Social Media Reports
- Facebook Ads Overview Report - GSheets version by Supermetrics
- Facebook Campaign Insights by The Next Ad
- Facebook Ads Insights by Owox
- The Ultimate Social Media Analytics Dashboard and Reporting Guide by Rival IQ
- Creating a Social Dashboard with Google Data Studio by Loves Data
Cloudflare Report
Error Report
Glossary Page
A Guide to Designing a Report
- Perfect Your Google Data Studio Dashboards with 7 Laws of UX by Supermetrics
- AARRR Framework- Metrics That Let Your StartUp Sound Like A Pirate Ship by Melanie Balke
Collections of Google Data Studio Report Templates
- Google Data Studio Report Gallery by Google
- Google Data Studio Resources by Helpfullee
- Google Data Studio templates by Supermetrics
- Google Data Studio Tumblr page by DataStudio
Other
- Non-standard Google Data Studio visualizations
- Radar Charts by Evan Snary
- How to measure Page Scrolling in Google Data Studio by Michael Howe-Ely
Google Data Studio Bugs (in 04.2019)
Here is a list of bugs discovered when creating this report template. Hopefully, the Google Data team is going to fix them in the nearest future.
- When you are selecting a custom colour for an item, the current colour always has an additional ‘ff’ attached at the end of the Hex Code.
- On laptops, reports with a title over 95 characters start to push the ‘Edit’ button off the screen making it invisible for users. It would be great to have a small icon appear in the bottom-right corner of the header allowing users to show the end of the header by moving all items to the left when UI elements (for example, icons and buttons) are pushed off the screen.
- When you sort data in ascending order by the ‘Day of week’ dimension from Google Ads, days are listed alphabetically, that is, Friday, Monday, Saturday, Sunday, Thursday, Tuesday, Wednesday, instead of their order, for example, Monday, Tuesday, Wednesday, etc., or Sunday, Monday, Tuesday, etc.
- Google Ads - ‘Total conv. value’ and ‘Value / conv.’ metrics have the type set to ‘Numeric’ instead of ‘Currency’, which doesn’t display the currency symbol next to the value.
Google Data Studio Feature Requests (in 04.2019)
Here is a list of features that would make creating and managing reports in Google Data Studio much easier. Hopefully, the Google Data team is going to implement them in the nearest future.
- Custom Themes - Setting variable theme colours, which can be used as the default colour by all tables, charts and graphs. The ideal solution would allow users to adjust the colours used by all tables, charts and graphs on all pages with a few clicks. It should save people a lot of time when creating a new table, chart, graph, etc. or updating the report colors to resemble the new client’s brand colors.
- Aggregating data - A way to show sessions by major browser versions, using dimensions or calculated fields, for example, aggregated Chrome 72.0 data instead of individual 72.0.3626.109, 72.0.3626.96, 72.0.3626.119, etc. Also, why there always seems to be a zero after the first full stop.
- Google Analytics domain variable - Taking the domain name from a Google Analytics property so that it can be used in calculated fields with hyperlinks and it does not need to be manually specified when the report is used to analyse the traffic of a new website.
- Modifying chart headers - Editing the header text in tables, metrics name and comparison label in scorecards to make them more descriptive or shorter.
- Official Google My Business connector - The current community connections are often paid and not straight forward to set up as official Google Analytics or Google Ads integrations.
- Hidden page label - In addition to an icon indicating that the page is hidden in the page control, it would be great to see a reminder in the Edit mode too. Some people usually use primarily the ‘left’ and the ‘right’ keyboard key to move between pages. This way they won’t see a reminder that the page is hidden and publish the new version of the report without making it visible. Perhaps, a grey bar below the ‘Toolbar’ in the Edit mode saying “This page is hidden from the View mode” could be not over distracting solution.
- Modifying the left and right padding of tables - The default width of the padding is a bit too small when you assign the table a different colour than the background colour.
- Update positive and negative change colours - Having the default ‘positive change colour’ and ‘negative change colour’ switched colours for the bounce rate and all page load. An increase in bounce rate represents a negative change and it should be shown by default in red in my opinion, while a decrease is positive and should be in green.
- Renaming the ‘positive change colour’ and ‘negative change colour’ titles to ‘increased value color’ and ‘decreased value colour’, as it’s not always accurate. For example, increase in bounce rate or page load is not something positive for a website.
- Multiple comparisons in scorecards, tables, charts - Ability to show multiple comparisons in scorecards, tables, charts, etc. will help better monitor and compare performance. For example, the previous period, the previous period last year and the previous period two years ago.
- Improved time series comparison alignment - Time series charts automatically aligning lines with data for the current period and previous period by day of the week. For example, values for the Monday, the 1st of April and Monday, the 4th of March are in the same place on the x-axes. The same for Tuesday, the 2nd of April and Tuesday, the 5th of March, etc.